
Sequim Radiation Level Monitor (RETIRED)
Nikola Broadband provides high quality, high speed wireless internet in and around Sequim, Washington, and as a service to our customers, we have built and installed a radiation level monitoring system so you can keep an eye on the level of radiation in Sequim!
NOTE: This project was defunded on 8/12/2013. Below is a historical snapshot.
About 1mSv/Year is the normal naturally occurring background radiation level from outer space and radioactive gases (such as Radon) which come from the ground.
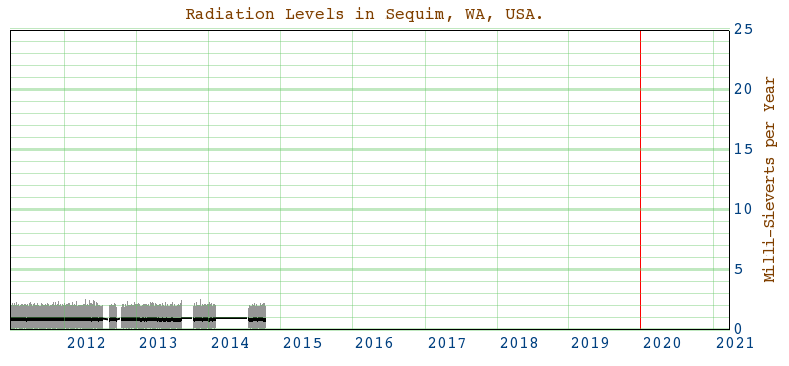
(Blank spots are times when a power outage caused loss of recent data.)
Data starts at left, and is added toward the right as it is recorded, and begins scrolling to the left when the new data is all the way to the right of the chart.
The vertical red line(s) marks the start of a new hour, day, week, month, or year, depending on which view you are looking at.
The maximum allowed levels for safe occupational exposure per the US government seem to be 25 mSv per year for medical radiation workers (like xray and medical imaging operators) and 50 mSv per year for nuclear power plant workers.
Nikola’s radiation level monitor counts particles using an LND 712 radiation detector tube in an Aware RM-60 detector unit, which connects to a small 12V operated solid state computer with no moving parts.
This small computer counts pulses, and creates the graph you see above.
The LND 712 detector tube is oriented pointing upwards inside a plastic enclosure out doors with a clear view of the sky in order to detect any radiation coming from the sky. There is also a small fan which circulates unfiltered fresh air in front of the tube continuously so as to quickly detect any airborne radiation sources.
The LND 712 tube detects each high speed particle that goes into it, including Alpha particles. The small attached computer then counts these pulses and groups them into one minute counts. In other words, at the end of each minute, the number of counts per minute is recorded to a file. This CPM or Count per Minute data is then used to generate the graph you see above. The counts per minute are then calculated, based on the size of the detector tube, to a standardized exposure type — specifically Milli-Sieverts per year. (For the LND 712 detector tube, 12 counts per minute is roughly equivalent to 1mSv/Year.)
If you want to see the raw data yourself, you may download it Here.
The format is two comma separated values per text line: The first is the time, in seconds since the beginning of 1970, (called Epoch time) and the second value is the number of counts per minute.